The paper was published in “Energo-Info” magazine in October 2018, №6, download PDF (4.5 MB).

2. Trading
2.1. Stages
2.2. Agreement examples
2.3. Consumers day ahead bid
2.4. Supplier day ahead bid
2.4.1. Thermal power plant day ahead bid
2.4.2. Other power plants day ahead bid
2.5. Day ahead auction
2.6. Day ahead auction results
2.7. Day ahead marginal price
2. Trading
2.1. Stages
To avoid situations where demand exceeds available supply, pricing on the wholesale market is organised in a way to incentivise participants to plan their consumption and production precisely.
There are two important terms: gate closure and settlement period.
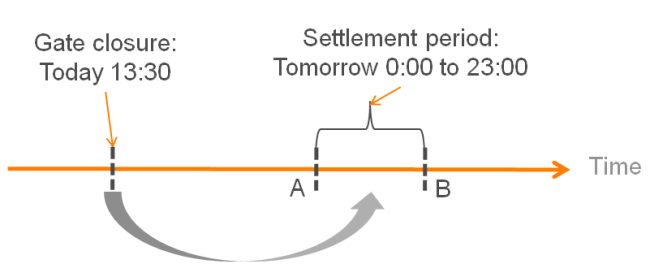
The gate closure is the moment of time when bidding for a certain settlement period ends. For example, today at 13:30 Moscow time the gate closes for the settlement period from 0:00 (point A on figure 3) to 23:00 (point B) the following day. No more bids are accepted after 13:30.
Electricity trading agreements can be grouped according to settlement period. The contracting process can be divided into four trading stages.
At the first stage, long-term agreements are made. For that purpose, in many wholesale markets (European Union, USA, etc.) a specific type of contract has been developed — the forward. According to a forward, parties buy and sell their intention to consume and produce electricity for a month, quarter, year and even several years ahead (settlement period).
In the Wholesale Electricity Market of Russia, no forwards are available and two types of long-term agreement have been introduced instead:
- Suppliers and distribution companies servicing the public make regulated contracts. Local executive authorities define volumes and prices of these contracts. The settlement period of each contract is one year: during the current year, the companies settle regulated contracts for the next year.
- Bilateral contracts. Parties settle the volumes and prices of the contracts. The settlement period can vary from a few hours up to a few months. According to wholesale market rules, the parties must pay transmission losses together.
The goal of long-term contracts is to either decrease price risk or gain additional profit.
At the second stage, participants trade their consumption and production plans for the day ahead. The settlement period is one day. This sector of the wholesale market is called the day ahead market. Again, as in the case of long-term agreements, the plans are bought and sold.
In the Wholesale Electricity Market of Russia, gate closure and settlement periods for the day ahead market match the example in figure 3. This gate closure also works for the bilateral contracts with settlement periods overlapping the following day.
At the third stage, the intraday trading takes place. The settlement period depends on the market and varies from half an hour to a few hours within the same day. Again, during intraday trading, short-term consumption and production plans are bought and sold.
The intraday market in Russia has a settlement period equal to the rest of the day, i.e. the number of hours before 0:00 the following day. The gate closes 2 hours before physical delivery.
At the fourth stage, after the intraday gate is closed, the balancing market takes over. In Russia, this market is not really a market but a sophisticated mechanism used by the System Operator to match production and consumption. To ensure power supply with a given network frequency, the System Operator commands power plants to increase or reduce their supply. In Russia, no control over the System Operator actions is taken.
At the very end, after actual consumption and production values are received from measurement systems, the deviation between the intraday schedule and actual volume is estimated. These deviations are bought and sold in the balancing market. Deals in the balancing market can be considered as post factum deals.
As shown above, the basic idea of the electricity market is one of multi-stage planning.
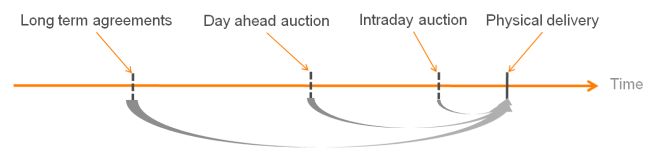
For a single moment of physical delivery of electricity, several planned stages take place (figure 4). The very first and the least precise is the long-term plan. The closer the delivery moment is, the more precise the plan is. The pricing schemes, applied to the electricity market, for the day ahead, intraday and balancing sectors have been developed to incentivise participants, especially consumers, to plan precisely. Under conditions of inelastic demand, this works the following way: the higher the deviation between the actual and scheduled consumption is, the higher the final electricity cost is and vice versa.
2.2. Agreement examples
According to the rules of the wholesale market of Russia, all participants compulsorily take part in the day ahead and balancing market. If for some reason, the participant does not bid on the day ahead auction, the System Operator will bid for them.
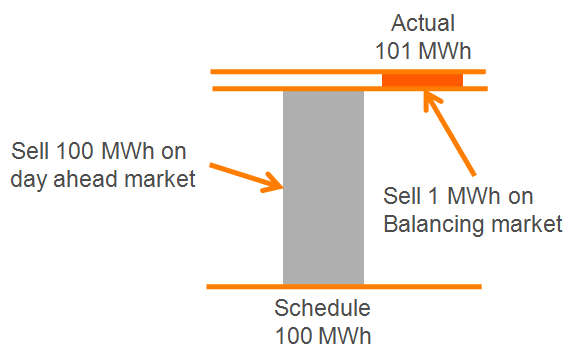
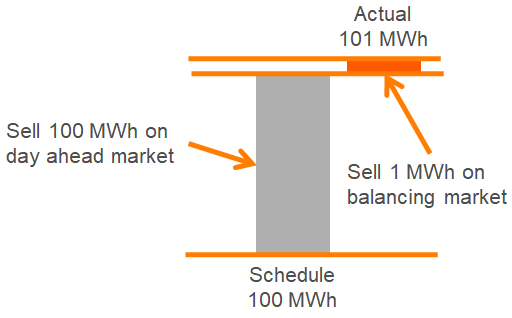
Let's look at agreement examples on the day ahead and balancing markets in the wholesale market of Russia for one supplier and one consumer, which has neither regulated nor bilateral contracts in place. The supplier sells his plan to produce 100 MWh tomorrow within the hour 0:00 to 1:00 Moscow time (figure 5). The trade hour is usually denoted by the start time, i.e. 0:00. How much electricity this supplier produces in that hour will be known after 1:00. If the supplier actually produces 101 MWh, it will have two deals (figure 5a):
- schedule = 100 MWh sale on the day ahead market;
- a deviation = actual – schedule = 101 – 100 = 1 MWh sale on the balancing market.
If the supplier actually produces 99 MWh, it will have the following two deals:
- 100 MWh sale on the day ahead market;
- 99 – 100 = –1 MWh sell, which is the same as a 1 MWh purchase on the balancing market.
It is similar for consumers. Assuming the consumer plans to consume 100 MWh in the same trade hour 0:00, if it actually consumes 99 MWh, it will have the following deals (figure 5b):
- 100 MWh purchase on the day ahead market;
- 99 – 100 = –1 MWh purchase, which is the same as a 1 MWh sale on the balancing market.
And vice versa, if it actually consumes 101 MWh:
- 100 MWh purchase on the day ahead market;
- 101 – 100 = 1 MWh purchase on the balancing market.
In the Russian Wholesale Electricity Market, participants bid their plans for the following day to the Administrator of Trade System. The Administrator of Trade System, in turn, collects all the bids, performs a so-called day ahead auction (p. 2.5) and estimates all volumes and prices for all the day ahead deals, considering amounts of regulated and bilateral contracts. In addition to the functions mentioned above, the System Operator collects all the bids for the intraday market and performs a so-called intraday auction. The Administrator of Trade System calculates total volumes and prices for all the deals on the balancing market at the very end.
In 2017 in Russia the day ahead market made up 76% of total wholesale electricity market turnover, the intraday and balancing markets combined made up 6%, regulated contracts made up 15% of total turnover and approximately 3% was related to bilateral contracts [5].
As the day ahead sector is the largest in terms of turnover, let's have a closer look at how it operates in the Wholesale Electricity Market of Russia.
2.3. Consumers day ahead bid
The consumer bid for the day ahead market usually looks like a three column table (table 1): the first column contains the trading hour, the second, consumption plans and the third, price.
Table 1. Example of the day ahead consumer bid
| Hour | Volume, MWh | Price, rub/MWh |
|---|---|---|
| 0:00 | 100 | |
| 1:00 | 150 | |
| ... | ... | ... |
| 23:00 | 90 |
If a consumer leaves the price cells empty, it declares its intention to buy electricity at any market price. This type of bid is called a price independent bid. Such bids reflect inelastic demand, as discussed earlier. In 2017 in Russia 99.5% of bids were price independent.
2.4. Supplier day ahead bid
Suppliers squeeze their production plans into a similar table with volume and price columns. Bids for thermal power plants look different from the bids for the other types of plant because of the difference in their variable costs (п. 1.5.1).
2.4.1. Thermal power plant day ahead bid
A thermal power plant burns fossil fuel, for example, gas, coal, etc., to produce electricity. Thermal power plants are sophisticated technologies that require a lot of effort to operate and control. Thermal power plants can produce electricity within a fixed range: from minimum operating limit to maximum operating limit. These limits are defined by gas or steam turbine technical characteristics. To switch on the thermal power plant a special startup programme is applied. For the thermal power plant, the variable cost of producing 1 MWh depends on a lot of factors: electricity load, heat load, the price of using fuel, outside temperature, etc.
A thermal power plant bid for each hour looks like a table, containing the approximation of a 1 MWh cost curve, sometimes called a characteristic curve. According to the market rules, this curve should be squeezed into only three points, while in reality it often has a more complex shape. To ensure offer price increment (the higher the offered volume, the higher the price) several rules have been developed for bidding:
- As electricity volume equal to the minimum operation limit will be produced anyway, that volume is bid as price independent (figure 6, point 1).
- The volume equal to maximum operation limit should be bid by the price equal to the cost of 1 MWh at maximum production including planned premium (figure 6, point 3).
- The middle volume (figure 6, point 2) can be included in the bid under the following conditions:
- volume 1 < volume 2 < volume 3;
- price 1 < price 2 < price 3.
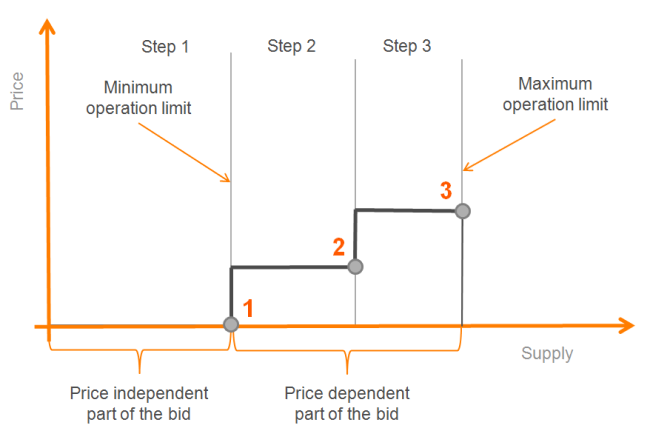
The production cost of 1 MWh between points is assumed to be constant. Since the bid chart (figure 6) is reminiscent of stairs, the points are usually called steps. A set of steps for 24 hours ahead looks like table 2.
Table 2. Example of a thermal power plant day ahead bid
| Hour | Step 1 | Step 2 | Step 3 | |||
|---|---|---|---|---|---|---|
| Volume 1 | Price 1 | Volume 2 | Price 2 | Volume 3 | Price 4 | |
| 0:00 | 150 | 250 | 900 | 300 | 1500 | |
| 1:00 | 150 | 250 | 900 | 300 | 1500 | |
| 23:00 | 150 | 250 | 900 | 300 | 1500 | |
The volume and price values in the bid are determined as a result of two mathematical problems:
- thermal power plant optimisation maximising profit — defining the volumes in the bid [12];
- calculation of so-called fuel rates — determining the cost for 1 MWh production which further is used to calculate the prices in the bid [3].
As a reminder — competition in any wholesale electricity market is possible only among the suppliers. In Russia, competition is possible only among thermal power plants. If a thermal power plant bids volume with a high price, that volume could be left unclaimed, i.e. non-accepted (figure 10). What is unclaimed supply? This is supply which could potentially be produced by power plants in operation. The schedule for power plants, whose offer is partly unclaimed, is below its maximum operating limit. Here two cases are possible.
1) For the power plant, it's more profitable to produce at maximum operating limit (produce as much as possible). If that power plant loses out competition to a neighbouring power plant, then part of its offer will remain unclaimed. In that case, the power plant will lose profit on the day ahead market.
2) For the power plant, it's more profitable to produce less than the maximum operating limit. The bid of such a power plant contains deliberately high prices reflecting the intention of the power plant to reduce its production.
It should be mentioned that the day ahead schedule (plan) is discussed at this stage. Furthermore, the schedule could be updated during intraday action and within the balancing activities of the System Operator.
2.4.2. Other power plants day ahead bid
Hydro, nuclear, solar and wind power plant bids look similar to consumer bids. These contain only one step (table 3). According to the rules of the Wholesale Electricity Market of Russia, the bids of these power plants should be price independent.
Table 3. Example of supplier day ahead bid
| Hour | Volume, MWh | Price, rub/MWh |
|---|---|---|
| 0:00 | 200 | |
| 1:00 | 200 | |
| ... | ... | ... |
| 23:00 | 200 |
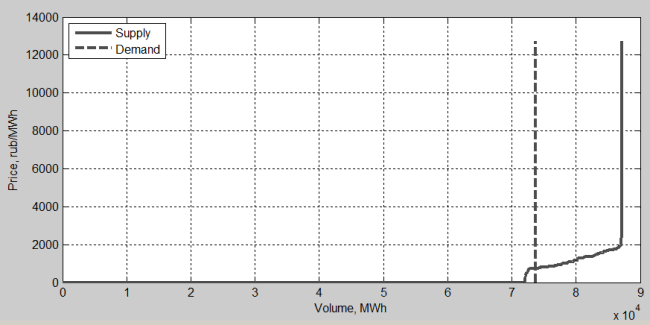
In 2017 these power plants bid 44% of total price independent supply on the day ahead market. The remaining 56% was bid by thermal power plants. In the same year, the total price independent supply on the day ahead market was 94.3% of total supply. This means that the price dependent supply comprised less than 6% of total supply. Thus it should be stressed that the price independent parts of supply and demand prevail in the Wholesale Electricity Market of Russia. Real supply and demand curves are represented in figure 7.
A few other types of bids are available on the electricity market of Russia, including integral day ahead bids and quick price independent intraday bids. These types are not discussed in this paper, but details can be found in [6], [11].
In the Wholesale Electricity Market of Russia, only volumes to be physically produced and consumed are traded. No financial contracts with 'virtual' volumes have been available since 2008. This means that if you are an owner of a power plant with an installed capacity of 30 MWh, you may only trade amounts up to 30 MWh.
2.5. Day ahead auction
When all participants have made bids on the day ahead market, the Administrator of Trade System performs a day ahead auction, which is, in fact, a mathematical optimisation problem **:
\[ F = \sum_{h=0}^{23} \left ( \sum_{c}C_c(h)P_c(h) - \sum_{g} c_g(h) P_g(h) \right ) \rightarrow max \hspace{1cm} (1)\]
Here \[C_c(h), P_c(h)\] are electricity consumption price (rub/MWh) and volume (MWh) within time step \[h\] and \[h+1\] from consumer bid; \[C_g(h), P_g(h)\] are price and volume from supplier bid. The objective function (1) represents the total profit of all participants, which is called the welfare function of the market [6]. In equation (1), the sum goes by so-called nodes \[c\] and \[g\]. Each node represents a power plant or its part, an individual block or a turbine, in the case of a generation node \[g\]; a transformer station or other distributing equipment in the case of consumption node \[c\]. Optimising parameters are supplier volumes \[P_g(h)\] in generation nodes. The optimisation problem (1) has a wide range of various constraints which come from the technical conditions of the power system [11].
** Consider the objective function with inelastic demand and for hourly bids (so-called integral bids are excluded from the discussion).
As can be seen from the problem statement, in Russia the nodal pricing system is applied to the wholesale market: each node gets an individual price value for a certain hour. In book [1], S. Stoft claims that this is the fairest pricing system from an economic perspective. The same pricing system is used on the PJM (Pennsylvania-New Jersey-Maryland) market in the USA. There is also another system — the zonal pricing system. In this, the optimisation problem statement differs from the one shown above. Zonal pricing is applied in Europe, Scandinavia, etc. For markets with zonal pricing all the suppliers and consumers, located in the specific area, or zone, get the same electricity price for a certain hour.
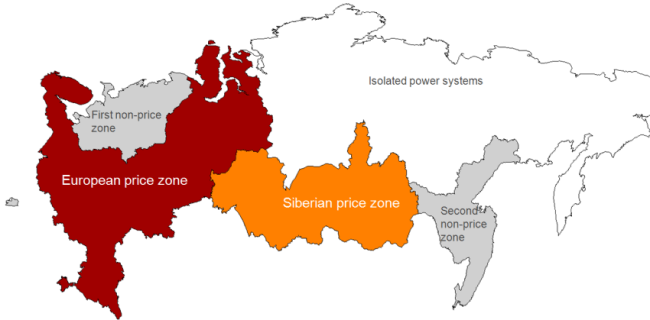
Nodes are spread widely geographically throughout Russia, so it was decided to divide the territory into two price zones:
- European price zone, containing more than 8000 nodes;
- Siberian price zone, containing more than 800 nodes.
Both price zones make up of 65 (out of 85) regions of Russia (figure 8). The remaining areas relate to non-price and isolated zones. In such areas, electricity is still bought and sold by tariffs.
The two price zones operate independently. The Administrator of Trade System solves the optimisation problem, through use of the Lagrange multipliers method, individually for each price zone.
2.6. Day ahead auction results
Consumption and production plans derived as a solution to the optimisation problem (1) for all participants are called the day ahead schedule.
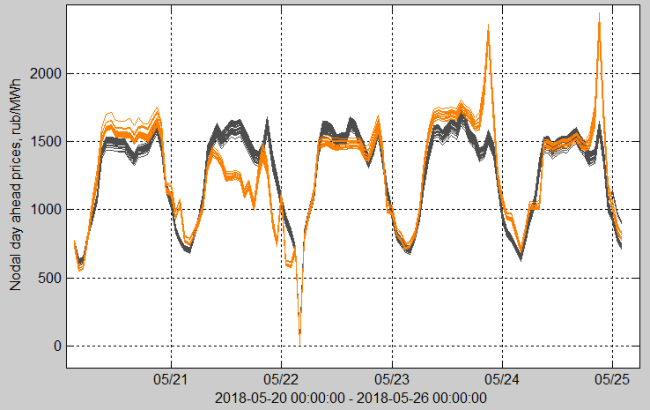
The price in each node of the power system is equal to the Lagrange multiplier value in the node. The price values represent the local marginal price and usually called the nodal day ahead prices. Generally, there is a unique price value in each node. The price difference between two nodes in the same hour could vary from zero to a few thousand rub/MWh. Prices in nodes located close to each other geographically usually show similar behaviour. The further apart nodes are located, the less alike their behaviour is (figure 9).
While the number of nodes is very high, the general market tendencies are usually estimated using aggregated prices, i.e. averages or weighted averages prices for zones of free flow or entire price zone [6]. A zone of free flow is an area where the power flow usually operates with no significant network constraints, similar to the zones of European markets. When the volume numbers are available it's recommended to use weighted averages prices; when they are not available, average prices. These weighted averages and average prices usually are called indexes [14].
2.7. Day ahead marginal price
The key indexes of the day ahead market are the buy and sell indexes aggregated by price zone. The first, the buy index, is the weighted average of all the consumption nodal prices. The second, the sell index, is that of generation nodal prices. The values of the two indexes are published daily on the Administrator of Trade System website. The two indexes can be fused together to make a single one — the weighted average of two indexes — which can be called the day ahead market marginal price (often referred to as the marginal price). If we allow some simplifications, it can be stated that on the supply and demand curves chart (figure 1b, figure 7) the marginal price is an intersection point [6]. The value of the marginal price shows whether the electricity price goes up or down on average in the entire price zone, i.e. in the greatest number of nodes (see below).
The nodes in which prices do not obey general market tendencies can be grouped by geographical location. There are several groups in the European price zone:
- North-West (Karelia Republic, Leningrad Oblast, Murmansk Oblast, Novgorod Oblast, Pskov Oblast);
- South (Chechen Republic, Dagestan Republic, Ingushetia Republic, Kabardino-Balkar Republic, Karachay-Cherkess Republic, North Ossetia-Alania Republic, Stavropol Krai, Krasnodar Krai);
- North-East (Kurgan Oblast, Tyumen Oblast, Perm Krai).
There are two groups in the Siberian price zone:
- East (Buryatia Republic, Irkutsk Oblast, Zabaykalsky Krai);
- West (Altai Krai, Altai Republic, Omsk Oblast, Novosibirsk Oblast).
These local groups are the result of poor interconnection between the group nodes and the rest of the price zones. At the beginning of this paper (p. 1.1), it was mentioned that a developed power network increases competition among suppliers. Poor interconnection leads to closed local competition among a few suppliers. This local competition makes group nodal prices behave peculiarly compared to the marginal price.
Below it is shown how the marginal price reflects the nodal price behaviour for both price zones. In 2017, when the marginal price daily average increased, i.e. the marginal price was higher than the previous day, the nodal prices daily average values went up for 81% and 84% of nodes in the European and Siberian zones respectively. Similarly, when the marginal price daily average decreased, the nodal prices daily average went down for 85% and 86% nodes (table 4).
Table 4. Changes in daily average prices in 2017
| European price zone | Siberian price zone | ||
|---|---|---|---|
| Marginal price | Nodal prices | Marginal price | Nodal prices |
| Increased | Went up for 81%, went down for 19% | Increased | Went up for 84%, went down to 16% |
| Decreased | Went down for 84%, went up for 16% | Decreased | Went down to 86%, went up for 14% |
Thus to estimate general market tendencies, a marginal price analysis is required.