The paper was published in “Energo-Info” magazine in October 2018, №6, download PDF (4.5 MB).

3. Day ahead price analysis
3.1. Price analysis problem
3.2. Solution
3.2.1. Factors impacting the marginal price
3.2.2. Highlighting the main factors
3.3. Marginal price analysis results
3.3.1. European price zone
3.3.2. Siberian price zone
3.3.3. Thomson Reuters weekly commentary
Conclusion
3. Day ahead price analysis
3.1. Price analysis problem
The day ahead price analysis problem can be stated in two ways.
The first problem (problem 1) is to answer the question: why does the price in the node have a particular value? This answer requires splitting the nodal price value into its components. One approach is offered in [15] and called the decomposition of the nodal price. To perform the decomposition, the availability of all the supply and demand parameters, derived as an optimisation problem solution (p. 2.5), is necessary. Unfortunately, the decomposition is impossible for market participants due to the inaccessibility of most of the input parameters.
While market participants can't solve price analysis problem 1, they usually solve the second problem (problem 2) by answering the question: what is the primary cause of price change for a specific node or group of nodes for a period (hour, day, week) compared to the previous period? To solve the problem it is necessary to:
- define the factors impacting the prices, the so-called price drivers (p. 3.2.1);
- highlight the main ones (p. 3.2.2).
3.2. Solution
Thomson Reuters (the company new name is Refinitiv) analysts solved the second price analysis problem through the development of the “Eikon Power Russia” analytical product. This product allows:
- price analysis for the Wholesale Electricity Market of Russia,
- temperature, demand, supply, price forecast.
As input data, the product mainly uses the openly available market data, regularly published on the websites of the Administrator of Trade System and the System Operator. Additionally, the weather data from the European Centre for Medium-Range Weather Forecasts is used.
The Eikon Power Russia product consists of four major parts:
- a system of grabbing data from web resources;
- a system of automated calculation, which is necessary for the price analysis and forecasts problems;
- a system which allows calculation results to be available to clients as files using FTP;
- a system of displaying the calculated results as a set of charts and tables.
The last system allows Eikon users to access the latest market results and forecasts.
Similar analytical products have been developed by Thomson Reuters analysts for the markets of Continental Europe, Scandinavia, United Kingdom, USA, Brazil, Australia and Turkey.
Let's go through the solution of the second price analysis problem using data from Eikon Power Russia for the primary market index — the marginal price.
3.2.1. Factors impacting the marginal price
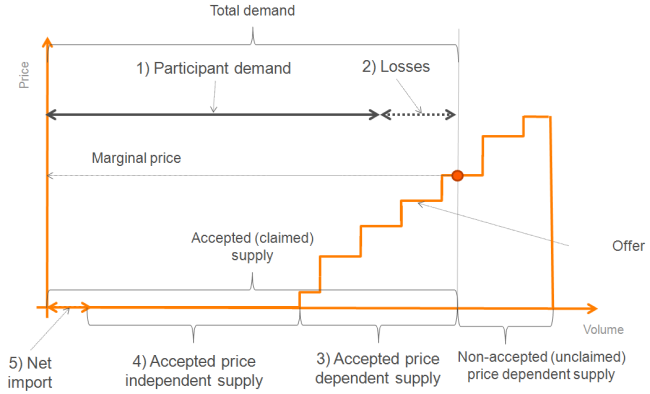
Total demand consists of participants' demand and losses. Furthermore, participants' demand is called merely demand. For price analysis purposes, five supply and demand components have been allocated (figure 10):
- demand,
- losses,
- accepted price independent supply (hydro, nuclear, solar, wind and thermal power plants),
- accepted price dependent supply (thermal power plants only),
- net import (the difference between import and export of electricity).
Automatic calculation of each component of supply and demand is performed in hourly resolution by the corresponding Eikon system every day. Following this, the average for each component is calculated daily, weekly, monthly and quarterly.
Demand. The demand value is available on the website of the Administrator of Trade System. It doesn't require any special treatment.
Losses. The losses depend on demand. To estimate the dependency, a report with regional daily losses is used. The report is available on the website of the Administrator of Trade System. On one hand, there are daily losses and on the other, daily demand. Once linear dependency is obtained for daily values, it's applied to hourly demand to get hourly losses.
Accepted price independent supply. Values of price independent supply for hydro and nuclear power plants are taken from the corresponding report available on the website of the Administrator of Trade System. Price independent supply of renewable power plants (solar and wind) is estimated as the sum of all regime generation units (special notation for individual blocks and turbines) with a corresponding technology type. Price independent supply of thermal power plants is calculated as the sum of two parts:
- the minimum operating level of all the thermal power plants for the price zone. The values are available on the website of the Administrator of Trade System;
- the volume of price independent supply above the minimum operating level, which is estimated based on several reports ***.
Accepted price dependent supply. This value is calculated as the difference between thermal power plant day ahead schedule and accepted price independent thermal power supply, obtained earlier.
Net import. The value of net import is the difference between total demand and total supply (figure 10). Note that the net import is included in day ahead auction as the price independent supply (p. 2.5).
*** The calculation is somewhat complicated due to a noticeable lack of the input data. If you need details, contact the author.
The demand and supply components are the factors impacting the marginal price, i.e. changes in marginal price are related to combined changes of these factors ****. Factor analysis allows Thomson Reuters power analyst and Eikon Power Russian clients to answer the question of why marginal prices have changed.
**** Price distortion by network flow constraints are not discussed in the paper; see article [15].
Price independent volumes for both supply and demand dominate the Wholesale Electricity Market of Russian (p. 2.3, 2.4). So, if price independent supply and net import are subtracted from total demand, the resulting value is the accepted price dependent supply. This supply, in its turn, defines the price value (figure 10). Marginal price analysis should be done in the following steps:
- price independent supply and demand analysis;
- estimation of changes in price dependent supply.
3.2.2. Highlighting the main factors
The main factors are the ones where change between the target and previous periods are higher than the others. The list of main factors depends on the target period. A power analyst defines this list as a result of marginal price analysis. Examples of marginal price analysis for the Wholesale Electricity Market of Russia are given below in p. 3.3.1 (European zone) and 3.3.2 (Siberian zone).
3.3. Marginal price analysis results
3.3.1. European price zone
Figures 11 and 12 show charts available via Eikon Power Russia. The top chart contains monthly averages for the factors, or price drivers, impacting the marginal price. The bottom one includes difference (change) between the current month value and the previous one for the period from July 2017 to May 2018 for the European price zone. The values for April and May 2018 are collected in table 5.
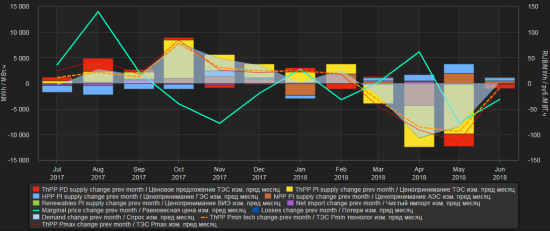
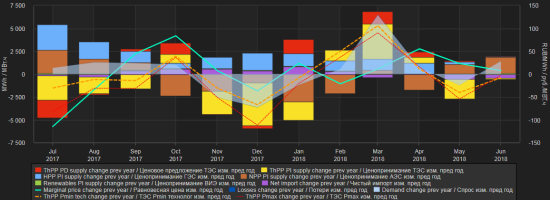
Table 5. Values for April and May 2018
| Month | April 2018 | May 2018 | Month to month change |
|---|---|---|---|
| Marginal price (rub/MWh) | 1 195 | 1 118 | -77 |
| Demand (GWh) | 87,2 | 78,7 | -8,5 |
| Price dependent thermal power plant supply (GWh)) | 7,4 | 4,9 | -2,5 |
| Price independent thermal power plant supply (GWh) | 51,8 | 42,1 | -9,7 |
| Price independent hydropower plant supply (GWh) | 9,4 | 11,1 | 1,7 |
| Price independent nuclear power plant supply (GWh) | 20,6 | 22,6 | 2,0 |
| Price independent renewable power plant supply (GWh) | 0,2 | 0,2 | 0,0 |
| Net import (GWh) | -1,2 | -1,4 | -0,2 |
| Losses (GWh) | 0,9 | 0,8 | -0,1 |
From table 5 it can be seen that the marginal price in the European price zone in May 2018 was 1118 rub/MWh. The price was below April's value by 77 rub/MWh. So, we are looking to answer the question: why was May's price lower than April's in 2018?
Price independent supply and demand analysis. Demand in May was 78.7 GWh, which is lower than in April by 8.5 GWh. Components of price independent supply changed the following ways:
- price independent hydropower plant supply went up by 1.7 GWh;
- price independent nuclear power plant supply went up by 2.0 GWh;
- price independent thermal power plant supply went down by 9.7 GWh.
The value of net import, losses and renewable supply didn't change noticeably.
Price dependent supply estimation. Changes in all the price independent components combined led to changes in price dependent thermal power plant supply: the volume went down from 7.4 GWh in April to 4.9 GWh in May 2018. The fall was 2.5 GWh.
Outcome. We found out that the price in May was lower than in April 2018 because demand reduction outpaced price independent supply reduction. In other words, demand went down faster than the price independent supply.
As a result, the value of price dependent thermal power plant supply went down by 2.5 GWh. This led to a price cut of 77 rub/MWh (figure 13). In this case, the main factors impacting the price were 1) price independent supply of thermal power plant and 2) demand.
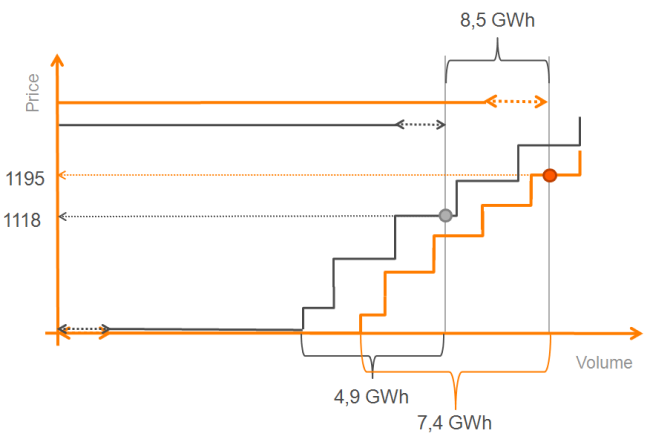
Orange — April 2018, Grey — May 2018
The fall in the price independent supply of thermal power plants by 9.7 GWh month to month should also be commented on. In this case, the rapid decrease is related to the cut in combined heat and power plants production. Electricity production of combined heat and power plant depends on the heat load of the plant which, in turn, depends on outside temperature; the colder the weather is, the more heat is required and vice versa. Usually in April, the so-called heating season ends in the European price zone, which leads to significant changes in heat load and, consequently, in power supply. The average combined heat and power plant power supply in May was 20.1 GWh while in April the value was 28.2 GWh (month to month change was 8.1 GWh).
3.3.2. Siberian price zone
Figures 14 and 15 show charts available via Eikon Power Russia. Similar to the previous example, the charts contain values and change for the factors impacting the price for the period of 13th to 20th June 2018 for the Siberian price zone. The values for 18th and 19th of June 2018 are collected in table 6.
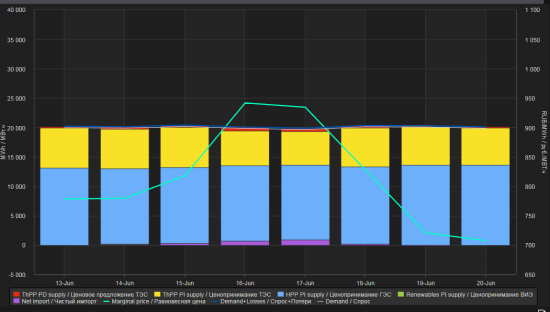
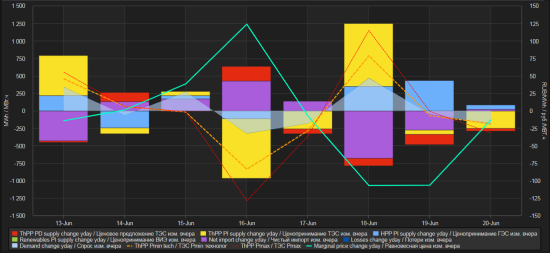
Table 6. Values for 18th and 19th of June 2018
| Date | 18 of June 2018 | 19 of June 2018 | Day to day change |
|---|---|---|---|
| Marginal price (rub/MWh) | 827 | 721 | -106 |
| Demand (GWh) | 20,10 | 20,05 | -0,05 |
| Price dependent thermal power plant supply (GWh) | 0,42 | 0,27 | -0,15 |
| Price independent thermal power plant supply (GWh) | 6,59 | 6,52 | -0,07 |
| Price independent hydropower plant supply (GWh) | 13,13 | 13,57 | 0,44 |
| Price independent renewable power plant supply (GWh) | 0,02 | 0,02 | 0,0 |
| Net import (GWh) | 0,19 | -0,08 | -0,27 |
| Losses (GWh) | 0,25 | 0,25 | 0,0 |
From table 6 it can be seen that in the Siberian price zone the marginal price was 721 rub/MWh for 19th June 2018, while a day earlier, 18th June, the price had been 827 rub/MWh. The price analysis problem is stated the following way: why did the price fall by 106 rub/MWh on 19th June compared to 18th of June?
Price independent supply and demand analysis. Price independent component changes 19th June compare to 18th June show that:
- demand remained at 20.05 GWh;
- price independent thermal power plant supply went down from 6.59 GWh to 6.52 GWh;
- price independent supply of hydropower plant went up from 13.13 GWh to 13.57 GWh;
- net import went down from 0.19 GWh to -0.08 GWh (on 18th June the price zone was importing electricity, while on 19th June it was exporting);
- price independent renewable power plant supply and losses didn't change noticeably.
Price dependent supply estimation. The volume went down from 0.42 GWh to 0.27 GWh as a result of changes in price independent components.
Outcome. The price on 19th June 2018 went down compared to 18th June due to the increase of price independent hydropower plant supply, which was not compensated enough by net import changes under the condition of stable demand. In other words, too much hydro production was made that day. Not all of this surplus production was exported and this led to the fall in the price. If all the surplus had been exported, prices would have remained stable. In this case, the main factors impacting the price were: 1) price independent hydropower plant supply, 2) net import and 3) price dependent thermal power plant supply.
3.3.2. Siberian price zone
Thomson Reuters analysts published weekly price change analysis results as a text commentary, similar to the cases above, every Monday of 2017-2018. Analysts were answering the question: why have marginal prices changed compared to the week before?
Besides the marginal price analysis results, the commentary contained discussion around the latest temperature, demand, supply and price forecast for the following week.
Conclusion
Electricity is distinguished from other commodities by two main features (flaws); firstly, the lack of real-time metering and, as a result, an uncertainty about the price of consumed electricity; and, secondly, the lack of real-time control of power flow and, as a result, practical inability to make the flow go from a particular seller to a particular buyer.
The result of these two features is a market construction where a special organisation buys all the electricity from producers and sells it on to consumers. The organisation is referred to as the power exchange or pool. In Russia, this organisation is named the Administrator of Trade System.
In Russia, both electricity and capacity markets operate. This means that suppliers split their costs into fixed and variable parts. Variable costs are considered when the supplier operates on the electricity market, fixed costs when they operate on the capacity market.
Electricity trading consists of several stages: a long-term stage with a trading horizon, called a settlement period, of up to several years; a short-term stage with a one-day horizon; an ultra-short-term stage with a horizon within the current day; and the real-time market. Market participants operate on the electricity market, mainly, by bidding their production and consumption plans. In Russia, the plans are formed in a specific table. The Administrator of Trade System collects the bids, performs a day ahead auction and defines volumes and wholesale day ahead prices for all participants. The System Operator performs an intraday market auction and balances the power system in real-time.
The wholesale electricity price analysis problem for a day ahead market can be stated in two ways. Problem one is trying to answer the question: why does the price in a specific node have a particular value? This problem cannot be solved by either market participants or analytical companies due to the unavailability of most of the input data. Problem two is trying to answer the question: why has the price changed in one period compared to the previous one?
A solution to the second problem has been provided by Thomson Reuters analysts through the analytical product Eikon Power Russia. To solve the problem, a comprehensive set of factors impacting wholesale prices is defined. The methodology for price analysis and two practical examples of marginal price analysis using Eikon Power Russia have been introduced in this paper.